Measuring a price change with per-product views, buyers and revenue
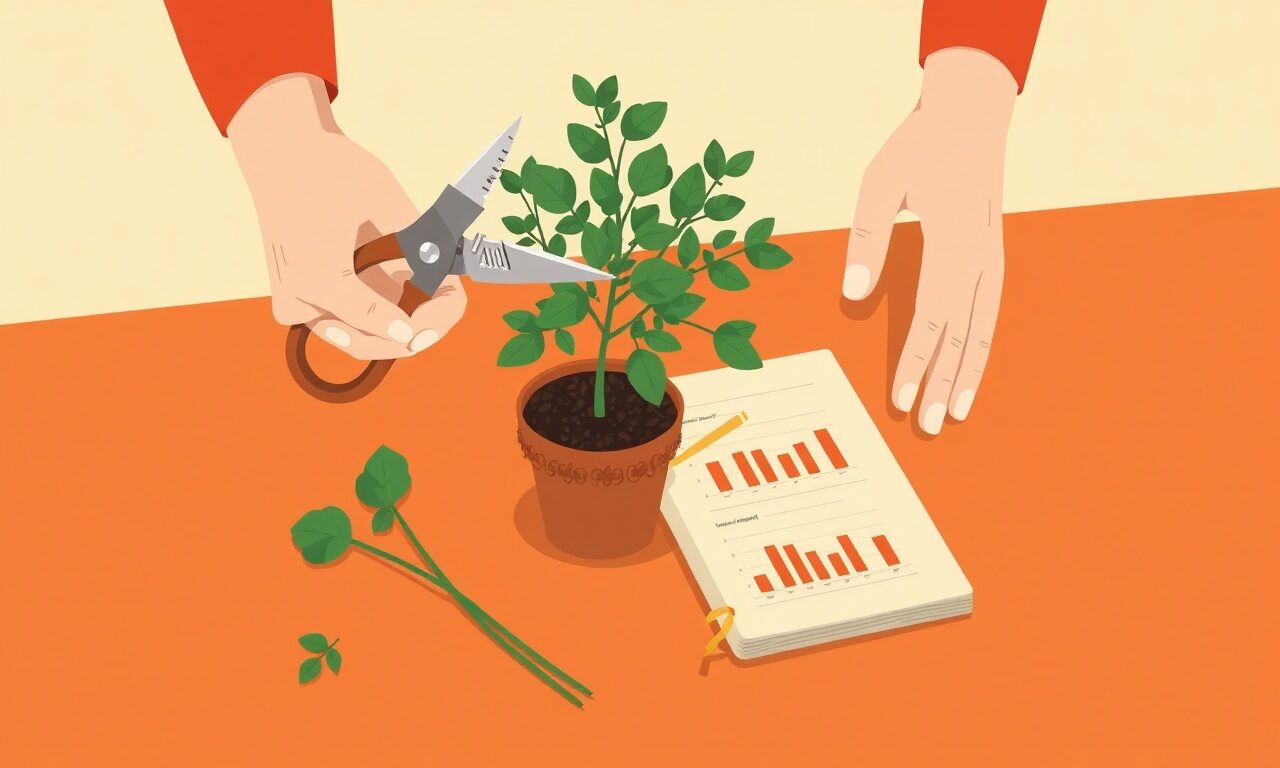
Set a before window, change one price only, then read views, buyers and revenue as three separate lines. That is how you find out whether the new price worked.

Three weeks ago you moved a product from $29 to $39. Since then you have checked the dashboard most mornings, and the honest answer is that you still do not know what happened. Some days feel worse. Last Tuesday was the best day of the month. You have a feeling, and a feeling is not a decision. The good news is that the numbers you need are already sitting in your store.fan analytics, split per product: views, buyers and revenue. The trick is reading them as three separate lines rather than one blurred impression.
Why the revenue total on its own misleads you
Revenue is two numbers holding hands: how many people bought, and what each one paid. When you raise a price you expect the first to fall and the second to rise. If revenue goes up, you still do not know whether that was the price working or simply a busier fortnight. If revenue goes down, you do not know whether the price is wrong or whether you posted less often.
The genuinely hard part is that you are not running a controlled experiment. Nobody selling to a normal creator audience is. Your traffic is lumpy, one video can double a week, and a school holiday can halve it. You are running a sequential test: old price for a while, new price for a while, with everything else in the world changing underneath. That is not useless, but it means the method has to do the work that a laboratory would otherwise do.
The method is simple. Hold everything else still, watch views as your sanity check, and compare revenue against a denominator rather than against a calendar month. Per-product analytics on store.fan gives you exactly those pieces, plus the traffic source, so you can see when a fresh crowd arrived and skewed the picture. Full analytics arrive from the Starter plan upwards, and the pricing page shows what sits on which tier.
The old way against a clean read
Most price decisions get made from memory and mood. Here is what changes when you take the numbers per product instead of per store.
| The old way | With store.fan |
|---|---|
| Compare this month's total takings to last month's | Compare one product's revenue per hundred views, before and after |
| Guess whether traffic was similar | Read the views line for that product and see whether it held |
| Notice the sale count dropped and panic | Expect fewer buyers at a higher price and check whether revenue still rose |
| Wonder if the new followers from that one video skewed things | Check traffic source for the window and see where the visitors came from |
| Change price, thumbnail and title at once, then argue about which worked | Change the price alone and leave everything else frozen for the window |
| Decide after four days because the suspense is unbearable | Decide when the after window matches the before window in length and volume |
How to run the test in the dashboard
This takes about ten minutes to set up and then mostly consists of leaving things alone, which is the difficult bit.
- 1Open Analytics in your dashboard and find the product you plan to reprice. Note its views, buyers and revenue for a clean stretch before today, ideally two to four weeks with no launch, no sale and no unusual post.
- 2Write those three numbers down somewhere outside the dashboard, along with the exact dates. This is your before window and it is now fixed.
- 3Work out revenue per hundred views for the before window: revenue divided by views, multiplied by one hundred. That single figure is what you are trying to beat.
- 4Open the product in Products, change the price, and save. Change nothing else: not the title, not the cover, not the description, not the bonus you were thinking of adding.
- 5Post about your work the way you normally would. Do not announce the price change, and do not run a discount code over the top of it.
- 6Wait for an after window of the same length as the before window, and at least as many views. If views are far lower, keep waiting rather than comparing a fortnight to a weekend.
- 7Read the three lines side by side: views, buyers, revenue. Then compare revenue per hundred views. That is your answer.
A worked example, with made-up but plausible numbers
Suppose a template pack sat at $29 for four weeks and collected 900 views, 27 buyers and $783. That is 3 buyers and $87 of revenue per hundred views. You move it to $39, change nothing else, and four weeks later you have 870 views, 21 buyers and $819. Buyer count fell by a fifth, which felt alarming on the days it was happening. Revenue per hundred views went from $87 to $94.
That is a modest win, and modest is the honest word for it: a seven per cent difference on numbers this small could easily be noise. What you have really learned is that the price rise did not break anything, which is usually the fear. The sensible next move is to leave $39 in place for another month and see whether the pattern holds, rather than immediately trying $49 because the first step did not hurt. If instead revenue per hundred views had dropped to $60, you would have your answer just as clearly, and you could put the old price back the same afternoon.
If you are still guessing at prices because your current setup only shows one lump sum, store.fan gives you views, buyers and revenue for every product, with no platform fee on any plan.
Start for freeThe mistake almost everybody makes
The mistake is changing the price on the same day you improve the sales page. It feels efficient. You are in there anyway, the cover photo has bothered you for months, the description could be tighter, so you fix all three and raise the price while you are at it. Then the number moves and you have no idea which of the four changes did it, and you will never find out, because you cannot unchange them one at a time in the reader's memory. Repricing is the cheapest change to make and the hardest to read, so give it a clean window of its own. Do your page improvements the week before or the week after, and note the date when you do.
Match them in length and, more importantly, in views. Two weeks each is a reasonable floor for a product that gets steady traffic. If a product only gets thirty views a week, stretch to a month or accept that you are reading a very noisy signal.
Anyone who already bought a one-off product keeps their access at the price they paid, and their private order page continues to work. If you replace the file later, they get the updated version at no extra cost.
Then something other than price moved, usually a post that travelled or a quiet fortnight. Check traffic source in analytics. If a new source appeared mid-window, that audience did not see the old price at all, so run the after window again once the spike has passed.
You can, and it answers a different question. A code tells you how people respond to a discount, not how they respond to a price. Discount codes are a Pro feature and are better used for campaigns than for measurement, because the code itself changes behaviour.
Pricing well is mostly a matter of being willing to find out. The measurement is not complicated: one change, two matched windows, three lines read separately, and a denominator so you are comparing like with like. Do that twice and you will trust your own prices more than any rule of thumb you read on the internet, including the ones on this blog.
Open a free store, put one product up, and watch its views, buyers and revenue from day one so your first price change has a before window worth comparing against.
Create your storeTurn your knowledge into income
Launch your Store.Fan in minutes — sell digital products, courses, and calls straight from your bio. Free to start.